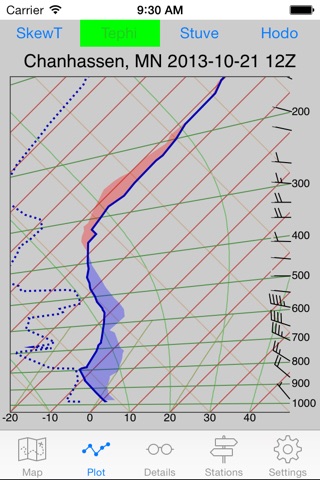


Display RAOB upper air data in a SkewT, Tephigram, or Stuve chart. Zoom the scale to see detail about inversion strength and height.
Collect data for consecutive cycles and show 12 or 24 hour temperature changes. Positive temperature changes shown in light red, negative changes shown in light blue.
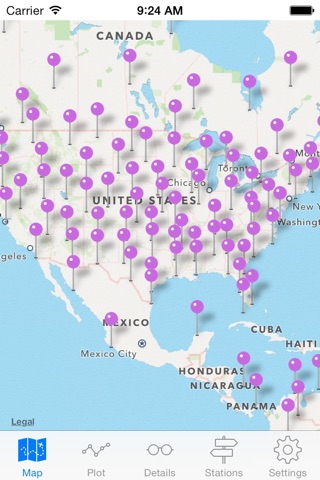
Aircraft pilots, balloonists, and soaring pilots can monitor upper air data at the nearest upper air station to help with flight planning.